
Your rankings are up 18%. Organic sessions are up 27%. The board asks how much pipeline SEO created, and the report suddenly becomes a tour of Google Search Console.
That is not a reporting problem. It is a measurement-design problem.
I have built reporting pipelines across multiple B2B SaaS products, moving data through APIs and Apps Script into Google Sheets and Looker Studio. The reports that survive scrutiny do not force every search interaction into one revenue number. They show the chain of evidence, the break in the chain, and what the team should do next.
This guide defines that system. It is deliberately different from my SaaS SEO strategy framework, which covers where and how to compete. Here, the subject is how to measure whether the work is reaching buyers, moving them through the product or sales motion, and producing commercial value.
Table of Contents
What Are SaaS SEO KPIs?
SaaS SEO KPIs are a small set of decision metrics connecting search availability and visibility to qualified acquisition, product or sales conversion, pipeline, and recurring revenue. A useful KPI has an owner, formula, source, segment, target, and response rule. Rankings and traffic are diagnostic signals; they are not revenue proof on their own.
A metric describes something. A KPI governs a decision. “Organic sessions” becomes a KPI only when the team agrees which sessions count, what good looks like, and what action follows a material change.
I use six measurement layers:
1. Technical availability: Can search engines and AI systems access, render, index, and retrieve the right pages?
2. Search visibility: Do those pages appear for non-brand commercial, problem, comparison, and integration demand?
3. Qualified acquisition: Do searchers reach the right landing pages from Google or an AI assistant?
4. Conversion and activation: Do they start a trial, request a demo, reach a meaningful product milestone, or become a qualified lead?
5. Pipeline: Do leads become accepted opportunities with credible value?
6. Revenue: Do opportunities close, activate recurring revenue, retain, and expand?
This order matters. If indexable commercial pages fall, investigate the technical layer before rewriting CTAs. If sessions rise but activation does not, visibility is not the immediate constraint.
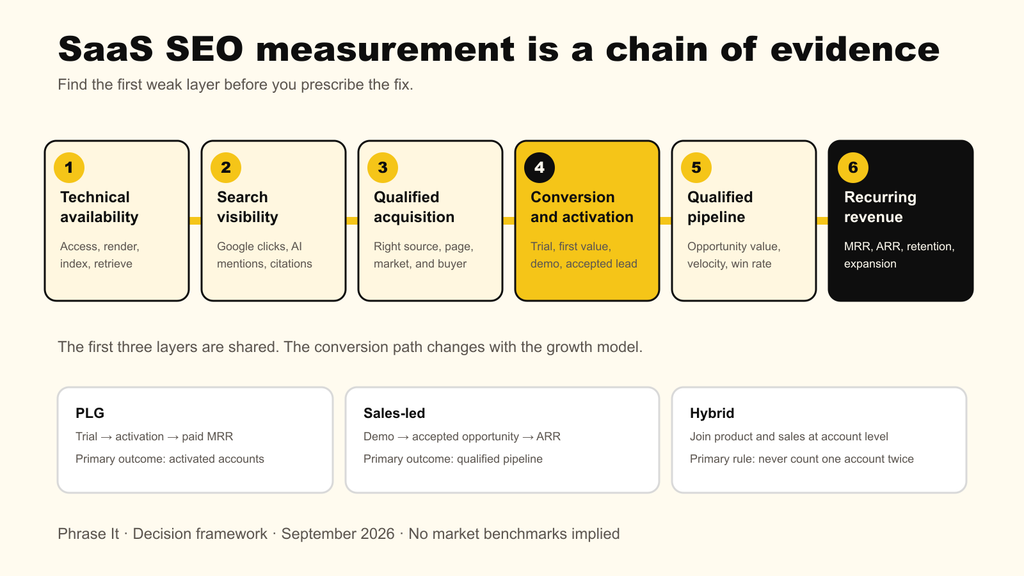
Figure 1. SaaS SEO measurement moves through six evidence layers, then branches for PLG, sales-led, and hybrid growth.
Start With a Metric Contract, Not a Dashboard
A metric contract is the written definition that keeps analytics, CRM, finance, and SEO teams from using the same label for different numbers. For every KPI, record the formula, system of record, attribution scope, included events, exclusions, comparison period, owner, target, and action threshold before building a chart.
Here is the minimum contract I use:
| Field | Example Contract |
|---|---|
| KPI | Organic-sourced qualified demo requests |
| Formula | Accepted organic demo requests ÷ all accepted demo requests |
| System of record | CRM for acceptance; GA4 for session context |
| Scope | First-touch organic source, US, non-customer, excluding spam and job seekers |
| Comparison | Trailing 90 days versus prior 90 days and year over year |
| Owner | Demand generation lead |
| Target | At least 25% of accepted demos from organic |
| Action threshold | Investigate if volume falls more than 15% and stays below the control band for two complete weeks |
Use a data dictionary as the control plane. Define trial_started, account_created, activated_account, demo_requested, marketing_qualified_lead, sales_accepted_opportunity, closed_won, MRR, and ARR once. Keep event versions and effective dates because product flows change.
Google distinguishes first-user, session, and event-scoped traffic-source dimensions in GA4. Those are not interchangeable. A first-user organic report answers an acquisition question; a session organic report answers a visit question; event attribution answers how credit was assigned to a key event.
Which SaaS SEO KPIs Belong at Each Layer?
The right scorecard combines outcome KPIs with the diagnostic metrics required to explain them. Keep leadership reporting small: one or two measures per layer. Store detailed query, template, event, and source data underneath so the team can investigate without presenting 40 equally important charts.
| Layer | Leadership KPI | Calculation Logic | Diagnostic Breakdowns |
|---|---|---|---|
| Technical availability | Commercial URLs eligible for search | Valid, canonical, indexable commercial URLs ÷ expected commercial URLs | Template, status code, robots, canonical, rendering, sitemap |
| Google visibility | Qualified non-brand clicks | Search Console clicks from approved query and landing-page groups | Impressions, CTR, average position, brand/non-brand, page type |
| AI visibility | Prompt citation share | Prompts with at least one cited brand URL ÷ eligible tracked prompts | Mention share, citation share, answer engine, prompt class, cited URL |
| Acquisition | Qualified search sessions | Organic and normalized AI-referral sessions landing on eligible pages | New users, geography, segment, page group, source |
| PLG conversion | Activated organic accounts | Organic-sourced or influenced accounts reaching the activation event | Trial rate, time to value, activation rate, plan, persona |
| Sales conversion | Organic-sourced or influenced opportunities | Accepted opportunities with organic evidence under the selected model | Demo rate, MQL-to-SQL, SQL-to-opportunity, stage velocity |
| Revenue | Organic-sourced and influenced ARR | Recurring contract value under separate source and influence models | Win rate, ACV, cycle length, expansion, churn |
Google Search Console defines CTR as clicks divided by impressions and recommends reading position as a trend rather than a precise rank. I segment those signals by page job: feature, solution, comparison, integration, tool, and educational content. A blended site average hides the page group that needs attention.
Use ratios only with their denominators. A trial conversion rate of 8% based on 25 sessions is not stronger evidence than 5% based on 2,500 sessions. Show the numerator, denominator, and comparison window together.
If your dashboard has traffic, rankings, and leads but no agreed path between them, Phrase It can turn the data into one measurement model and an implementation backlog. Give marketing, product, sales, and finance the same definitions.
See the SaaS SEO approachHow Should PLG SaaS Companies Measure SEO?
PLG SaaS companies should treat activation—not the trial start—as the main product outcome. Track qualified organic visitors through account creation, the product’s first-value event, activation, paid conversion, MRR, retention, and expansion. Report time to value and activation by landing-page group so high-volume content does not mask low-quality acquisition.
For a PLG motion, I usually define these formulas:
- Visitor-to-trial rate = new trials from the segment ÷ eligible sessions from the segment.
- Trial activation rate = activated trial accounts ÷ valid trial accounts.
- Trial-to-paid rate = new paid accounts ÷ valid trial accounts after a complete conversion window.
- Organic new MRR = recurring monthly value of new customers attributed to organic under the declared model.
- Activation-adjusted acquisition = qualified sessions × visitor-to-trial rate × activation rate.
The activation event must represent real product value. “Logged in” is rarely enough. It may be creating a first project, importing data, inviting a teammate, publishing an asset, or completing the workflow that predicts retention.
Set thresholds against your own baseline. Start with an eight- to twelve-week control band for each page group. Investigate when a material KPI moves beyond normal variation for two complete reporting periods, or when a release creates an abrupt step change. Do not import a universal “good SaaS conversion rate” from an unrelated pricing model.
One SaaS client increased sign-up conversions after content and key landing pages were optimized. The useful lesson is not an unsupported universal uplift. It is that visibility and sign-ups belonged in the same page-level review, so the team could see whether the change attracted more demand, converted existing demand better, or did both.
How Should Sales-Led SaaS Companies Measure SEO?
Sales-led SaaS companies should follow organic demand from qualified demo or contact request through lead acceptance, opportunity creation, pipeline value, win rate, closed-won ARR, and sales-cycle length. Separate sourced from influenced pipeline, require stable CRM campaign or touchpoint rules, and use complete cohort windows before judging revenue performance.
A clean sales-led scorecard uses:
- Qualified demo rate = accepted demo requests ÷ eligible search sessions.
- Lead-to-opportunity rate = new opportunities ÷ accepted leads.
- Organic-sourced pipeline = total opportunity amount where organic meets the agreed source rule.
- Organic-influenced pipeline = total opportunity amount where an eligible organic touch occurred before opportunity creation or close.
- Pipeline velocity = opportunity count × average contract value × win rate ÷ average sales-cycle days.
Do not add sourced and influenced pipeline together. They overlap. Present them as two lenses with clear rules.
I also compare lead quality by landing-page group. A comparison page can generate six accepted opportunities from 300 visits while a broad guide generates one from 10,000. The guide may support discovery, but the comparison page deserves more commercial weight.
Delay the verdict until the cohort matures. If the median sales cycle is 90 days, last month’s organic demos cannot yet support a closed-revenue conclusion. Report leading conversion now, pipeline formation later, and won revenue only after enough of the cohort has had time to close.
How Should Hybrid SaaS Companies Join Product and Sales Data?
Hybrid SaaS companies need one acquisition layer and two conversion branches. Track self-serve users through activation and paid MRR, sales-assisted accounts through accepted pipeline and ARR, then join both at the account level. Prevent double counting when a trial later requests a demo or an account moves from self-serve to sales-assisted.
Use a persistent account key where privacy and consent permit. Join anonymous session context to a user only after identification, then join users to accounts, opportunities, subscriptions, and invoices with documented logic.
| Hybrid Event | Primary Owner | Counting Rule |
|---|---|---|
| Trial starts, no sales touch | Product growth | PLG branch until a qualifying sales interaction occurs |
| Trial requests a demo | Revenue operations | One account; retain product history and mark sales-assisted transition |
| Multiple users from one company | Revenue operations | Roll up users to the account before pipeline reporting |
| Self-serve account upgrades through sales | Finance or billing | Count expansion once; preserve the original acquisition evidence |
| Partner or reseller closes the deal | Finance plus CRM | Record partner as close source and organic as influence only when evidence exists |
The executive view can show total search-influenced new ARR. The operating view must retain the branches, because the next decision differs: improve onboarding for weak activation, or improve qualification and sales follow-up for weak opportunity creation.
Phrase It connects prompt visibility, cited pages, normalized referrals, on-site behavior, and commercial actions. See what is measurable, what is dark, and what the evidence can honestly support.
Explore AI SEO servicesHow Do You Track AI Search Without Inventing Precision?
Track AI search in four separate views: prompt visibility, brand mentions, cited URLs, and measurable referrals or conversions. Normalize known source variants before aggregating sessions. Then add self-reported discovery and CRM evidence because some AI-assisted visits arrive without a referrer, cross devices, or return later through direct, branded search, email, or sales.
Normalize AI Referral Sources
GA4’s source and medium fields describe recorded traffic origins, but assistants do not always send a stable referrer. Create a controlled mapping table rather than scattering regex rules across dashboard charts.
| Raw Source Example | Normalized Source | Channel | Review Rule |
|---|---|---|---|
| chatgpt.com, chat.openai.com | ChatGPT | AI referral | Add new OpenAI-owned source variants after validation |
| perplexity.ai, perplexity | Perplexity | AI referral | Preserve raw value in a separate field |
| gemini.google.com, bard.google.com | Gemini | AI referral | Keep historical aliases documented |
| claude.ai | Claude | AI referral | Do not infer Claude when referrer is absent |
| copilot.microsoft.com, bing.com chat paths | Microsoft Copilot | AI referral | Validate path and referrer before reclassification |
Keep raw_source, raw_medium, normalized_source, mapping version, and effective date. Reprocess history when the rule changes, or annotate the break.
Measure Prompts, Mentions, and Citations Separately
Build a prompt set from real category, problem, feature, alternative, comparison, integration, risk, and purchase questions. Run the same prompts across target systems with a fixed geography, language, account state, and cadence where the platform permits.
- Mention rate = tracked prompts that mention the brand ÷ eligible prompts tested.
- Citation rate = tracked prompts citing at least one brand URL ÷ eligible prompts tested.
- Citation share = brand citations ÷ all citations recorded in the reviewed answers.
- Competitive mention share = brand mentions ÷ mentions of all defined competitors.
Save the prompt, platform, date, answer, cited URL, brand mention, competitor mentions, and result status. A single manual result is a screenshot, not a trend.
My LLM SEO guide explains the wider visibility system. The agentic browsing troubleshooting guide covers a different but related question: whether an agent can access, understand, and complete a task on the site after discovery.
Capture Branded/Direct AI Discovery
Branded/direct means AI-assisted discovery that analytics cannot directly identify. The user may copy a URL, switch device, type the brand into Google, or return as direct traffic.
Do not relabel all direct traffic as AI.
Add one optional, open-text question at a meaningful conversion point: “How did you first hear about us?” Keep the raw answer, then classify it into a controlled field such as ChatGPT, Perplexity, Google AI, colleague, community, podcast, or other. Audit a sample monthly because people write “Google,” “AI,” or “a chatbot” imprecisely.
Report three lines: directly measured AI referrals, self-reported AI discovery, and accounts with both signals. The overlap prevents double counting. The remainder shows evidence that standard referrer reporting missed, not a perfect attribution correction.
What Does a Defensible AI-Referral Case Study Show?
A defensible SaaS SEO case study reports the measurement window, comparison period, source-normalization rules, conversion definitions, concentration, and missing revenue data alongside the headline result. It proves what the available dataset supports. It does not turn trial growth into revenue, treat one assistant as the whole market, or imply one tactic caused every change.
In Phrase It’s AI-referral case study, one real estate technology company recorded 1,458 AI referral sessions over July 22, 2025–July 21, 2026, up 21.4% against the preceding dashboard period. Key events reached 80, up 90.5%, and free trials reached 37, up 117.6%.
The important reporting detail sits behind the headline. ChatGPT produced 1,246 sessions and 69 key events, so source concentration was high. The dashboard recorded no purchase revenue, so the case supports measurable trial and key-event growth—not closed revenue.
I have also measured a session key-event rate as high as 25% from ChatGPT traffic for one SaaS client, with key events including sign-ups and purchases. That is an observed account result, not a market benchmark or causal promise.
These examples are why saas seo case studies is supporting evidence here rather than the article’s main target. A case should demonstrate the measurement standard, not interrupt the operating guide with a victory lap.
How Do You Connect SEO to MRR, ARR, and Revenue?
Connect SEO to revenue by preserving source and influence evidence at the person and account levels, joining those records to opportunities and billing, and reporting multiple attribution views side by side. Use actual MRR or ARR when available. Use pipeline-weighted estimates only for forecasting, label the probability, and never present them as booked revenue.
The core calculations are straightforward:
- New organic MRR = sum of new monthly recurring charges from customers meeting the declared organic-source rule.
- New organic ARR = sum of new recurring annual contract value under the same rule. For simple monthly subscriptions, annualized MRR is MRR × 12; contracted ARR should come from billing or finance when available.
- Organic-sourced pipeline = sum of open and won opportunity values meeting the source rule.
- Expected organic pipeline = sum of each opportunity amount × its stage probability.
- SEO ROI = (recognized gross profit attributed under the model − SEO cost) ÷ SEO cost × 100.
Use gross profit rather than topline revenue when costs to serve materially differ across plans. Align the cost and return windows: content and technical investment this quarter may influence revenue months later.
Phrase It’s SEO revenue reporting guide goes deeper into joining Search Console, GA4, CRM, and finance evidence. My default leadership table keeps attribution honest:
| Revenue View | What It Answers | Limitation |
|---|---|---|
| First-touch organic | Which customers first entered through organic search? | Misses earlier offline discovery and later channel influence |
| Last non-direct organic | Which conversions ended with an identifiable organic touch? | Undervalues earlier content and AI discovery |
| Multi-touch influence | Which accounts had an eligible organic touch before conversion? | Broad rules can over-credit common touches |
| Self-reported discovery | What source does the buyer remember? | Memory and category labels are imperfect |
| Incremental evidence | What changed against a control, holdout, or credible baseline? | Often difficult for small samples and long sales cycles |
Do not collapse the five views into an unexplained “SEO revenue” total. Choose one primary model for planning, retain the others as context, and reconcile material differences every quarter.
If leadership cannot tell whether SEO created revenue, influenced it, or merely appeared in the path, bring your current Search Console, GA4, CRM, and billing setup. I will show you the first break in the chain.
Book a 30-minute strategy callFree Download: The 100-Point SaaS SEO Audit Checklist
A crawler can flag hundreds of issues without telling you which one is costing you trials, demos, or revenue.
I turned this audit framework into a practical 33-page checklist covering 100 revenue-influencing SaaS SEO mistakes. Every check includes the revenue risk, the fix, and the evidence you should use to verify the work.
Use it to audit:
- Revenue-relevant demand and page architecture
- Search intent, content relevance, and product evidence
- Crawling, rendering, indexation, and canonicalization
- Internal links and external authority
- AI mentions, citations, and message accuracy
- Trial, demo, and signup paths
- Analytics, CRM attribution, and implementation priorities
This is not another list of technical warnings to clear indiscriminately. It helps you find the earliest failure in the path from buyer demand to revenue—and decide what deserves fixing first.
Which Thresholds Should Trigger a Decision?
Decision thresholds should combine business materiality, normal variation, sample size, and persistence. Use fixed operational gates for breakage, baseline-relative bands for performance, and cohort maturity for pipeline or revenue. A threshold should trigger an investigation or action—not automatically assign a cause to SEO, content, product, or sales.
I use this practical starting set, then calibrate it to the account:
| Signal | Starting Decision Rule | First Response |
|---|---|---|
| Indexable commercial URLs | Any priority URL becomes non-indexable, non-200, or incorrectly canonicalized | Same-day technical investigation |
| Qualified non-brand clicks | More than 15% below expected range for two complete weeks, adjusted for seasonality | Segment by query, page, country, device, and release |
| Trial or demo tracking | Event count breaks from backend or CRM count by more than 5% | Audit tags, consent, deduplication, and event version |
| PLG activation rate | Falls outside the eight- to twelve-week control band with at least 100 valid trials | Segment by landing page, plan, persona, and product release |
| Sales acceptance rate | Falls more than 20% with at least 30 accepted/rejected leads | Review intent, spam, qualification, routing, and SLA |
| AI prompt visibility | Three consecutive runs show a material loss across the same prompt class | Inspect cited sources, answer volatility, and page availability |
| Pipeline or ARR | Below plan after the cohort reaches the median conversion window | Reconcile source, quality, stage velocity, win rate, and sales cycle |
The sample gates are safeguards, not statistical laws. Low-volume enterprise SaaS needs longer windows and account-level review. High-volume self-serve SaaS can use tighter control limits and faster experimentation.
How Often Should You Report SaaS SEO Performance?
Report each KPI at the speed at which it can change and support a decision. Monitor technical failures daily, diagnose acquisition weekly, review conversion monthly, evaluate pipeline by cohort monthly or quarterly, and reconcile revenue quarterly. Leadership should receive a short monthly narrative with exceptions, causes under investigation, and the next approved action.
| Cadence | Review |
|---|---|
| Daily alerts | Priority URL availability, robots, canonicals, analytics collection, broken forms, major release regressions |
| Weekly operating review | Qualified clicks and sessions, page groups, trials or demos, AI referrals, prompt sampling, experiments |
| Monthly performance review | Activation, lead acceptance, opportunity creation, conversion paths, source reconciliation, cost |
| Quarterly business review | Matured cohorts, sourced and influenced pipeline, MRR/ARR, CAC context, retention, investment decisions |
Every report should answer four questions in order:
1. What business outcome changed?
2. Which layer explains the change?
3. How confident are we, and what does the data not show?
4. What decision or implementation change follows?
In my own reporting work, APIs and Apps Script move SEO and AI-referral data into shared Sheets and Looker Studio dashboards. Automation saves collection time, but the main value is consistency: the same definitions, mappings, filters, and comparison windows appear every time.
What Attribution Limits Must the Report State?
Every SaaS SEO report should state that referrers can disappear, consent and browser controls limit observation, people switch devices, CRM fields can be overwritten, sales cycles create lag, account joins are imperfect, and attribution models allocate credit rather than reveal objective causality. These limits do not make reporting useless; they define the confidence of each claim.
Google notes that modeled key events can estimate activity that was not directly observed and that attributed conversion data may update after collection. Treat a recent number as provisional when the platform says processing continues.
Also document these account-specific limits:
- Whether self-serve purchases and invoiced contracts share one billing system.
- Whether CRM source fields preserve their original value.
- Whether opportunities contain multiple contacts with different histories.
- Whether trial, activation, and demo events are deduplicated.
- Whether AI source mappings cover only measurable referrals.
- Whether revenue means booked, billed, recognized, or annualized recurring value.
Precision in the chart does not remove uncertainty in the model. I would rather show an attributed range with explicit rules than a confident total nobody can reproduce.
How Do You Know an Organic Visitor Became an Activated User?
To connect organic search with product adoption, you need to join the visitor’s acquisition data to a stable user or account ID after signup. Product events must then use the same identifier. This creates a traceable path from an organic landing session to trial creation, activation, and eventual paid conversion.
Google Search Console cannot tell you which individual searcher created an account. It reports aggregated query, impression, click, and landing-page data.
The connection happens through your analytics, application, and backend data.
How the Attribution Flow Works
A typical PLG attribution flow looks like this:
- A visitor arrives from organic search. GA4 records the session source and medium—such as
google / organic—along with the organic landing page. - Analytics assigns an anonymous identifier. Before signup, GA4 may recognize the visitor through a
client_idoruser_pseudo_id. This identifies a browser or app instance, not a known person. - The visitor creates an account. Your application assigns an internal
user_id. For a product used by teams, it should also assign anaccount_idor organization ID. - The identifiers are connected. Where consent and your privacy policy permit it, the signup process connects the pre-signup analytics identifier with the new internal user and account.
- Product events carry the same identifiers. Events such as
project_created,data_imported,integration_connected, orteammate_invitedshould include the appropriateuser_idandaccount_id. - The reporting model checks for activation. Your warehouse or product analytics platform determines whether that user or account completed the event—or combination of events—you defined as activation.
The resulting record may look like this:
| User ID | Account ID | First Source | Organic Landing Page | Trial Started | Activation Event | Activated |
|---|---|---|---|---|---|---|
usr_4821 | acct_903 | google / organic | /product/analytics/ | Sept. 2 | dashboard_published | Yes |
This record supports a defensible statement: a user acquired through organic search started a trial and later completed the defined activation event.
You can then calculate:
Organic trial activation rate = activated organic-sourced trial users ÷ valid organic-sourced trial users
For an account-based product, I would usually replace users with accounts:
Organic account activation rate = activated organic-sourced accounts ÷ valid organic-sourced trial accounts
Decide What “Organic-Sourced” Means
Before calculating either rate, define which attribution model determines the source:
- First-touch organic means organic search was the first recorded way the user reached the site.
- Trial-session organic means the session in which the person created the trial came from organic search.
- Last non-direct organic means organic was the last identifiable source before signup, ignoring a later direct visit.
- Organic-influenced means organic appeared somewhere in the known journey, even if another channel received acquisition credit.
These models answer different questions. Do not switch between them depending on which one produces the most impressive result.
I prefer reporting organic-sourced and organic-influenced activation separately. The sourced view supports acquisition reporting. The influenced view shows where search contributed to a longer journey.
Why the Match Is Never Perfect
The connection is strongest when someone accepts tracking, signs up in the same browser, and keeps the same identifier. Even then, it represents the best available recorded path—not perfect knowledge of everything that influenced the decision.
The connection may be incomplete when someone:
- Rejects analytics cookies.
- Clears browser storage.
- Switches devices before signing up.
- Discovers the product through search but returns through a bookmark or branded search.
- Shares the product with a colleague who creates the account.
- Starts anonymously but signs up through a flow that does not preserve the original identifier.
Do not classify all unattributed or direct signups as organic. Keep them in an unattributed category unless you have supporting evidence, such as a self-reported answer.
Measure the Account When the Account Adopts
B2B SaaS makes user-level attribution especially difficult. One employee may discover the product through Google, another may create the trial, and several colleagues may complete the actions that qualify the account as activated.
That is why account-level measurement is often more truthful.
Preserve the histories of individual users, but roll them up to the account before reporting pipeline or revenue. Define whether the account is organic-sourced based on its first known user, trial creator, buying contact, or another documented rule.
The final report should separate:
- Organic-sourced activation: The user or account entered through organic under the selected attribution model and later activated.
- Organic-influenced activation: Organic appeared in the known path but did not receive primary source credit.
- Unattributed activation: The product was adopted, but the available identifiers cannot establish how the user or account was acquired.
This approach gives you a reproducible measurement system without claiming that every product user can be traced perfectly.
Build a KPI System That Can Say No
The best SaaS SEO KPI system does more than prove success. It can clearly show that traffic growth is unqualified, that an activation problem belongs to product, that pipeline has not matured, or that the revenue claim exceeds the data.
That honesty makes the system useful. Once every layer has a definition, owner, threshold, and cadence, your team can stop debating whose dashboard is right and decide what to fix, scale, or stop.
If your SaaS SEO report stops at rankings—or jumps straight from traffic to revenue—I can help you build the missing measurement chain. Share your growth model, data sources, and the decision leadership needs to make.
Discuss your SaaS reporting systemFrequently Asked Questions About SaaS SEO KPIs
The best SaaS SEO KPI is the closest reliable business outcome for the company’s growth motion: activated accounts for PLG, accepted pipeline for sales-led, and account-level revenue across both branches for hybrid SaaS. Supporting search and conversion signals explain why that outcome moved and where the team should act.
What Metrics Should You Track for SaaS SEO?
Track technical eligibility, qualified non-brand clicks, qualified organic and AI-referral sessions, trials or demos, activation or lead acceptance, opportunities, sourced and influenced pipeline, and MRR or ARR. Segment them by page type and acquisition model. Keep rankings, impressions, CTR, and engagement as diagnostics rather than standalone proof of business value.
What Is the Most Important SaaS SEO KPI?
The most important KPI is the nearest reliable commercial outcome you can measure with enough volume and a complete time window. For PLG, that is often activated organic accounts. For sales-led SaaS, it is accepted organic-sourced or influenced pipeline. Revenue becomes primary only when CRM and billing joins are trustworthy.
How Do SaaS SEO KPIs Differ From General SEO KPIs?
SaaS SEO KPIs must account for recurring revenue, product activation, long sales cycles, account-level buying, and multiple acquisition motions. A publisher may optimize pageviews or ad revenue. SaaS teams need to connect search to trials, product value, demos, opportunities, MRR, ARR, retention, and expansion without double counting accounts.
How Do You Attribute Organic Revenue for a Subscription Business?
Preserve first-user, session, and event-level source evidence; join identified users to accounts; connect accounts to opportunities and billing; then report sourced and influenced revenue separately. State the attribution window and revenue definition. Compare analytics with self-reported discovery and CRM history, but do not add overlapping views into one total.
How Do You Measure AI Search Performance for SaaS?
Measure prompt-level mentions and citations separately from website referrals. Normalize known assistant source variants, track landing pages and key events, and collect optional self-reported discovery for visits with no usable referrer. Report direct AI referrals, self-reported AI discovery, and their overlap so the same account is not counted twice.
How Often Should SaaS SEO KPIs Be Reported?
Monitor technical failures daily, review acquisition and tracking weekly, analyze conversion monthly, and judge pipeline or revenue with matured monthly or quarterly cohorts. A monthly leadership report should show outcomes, exceptions, attribution limits, and decisions. Do not force slow revenue signals into the same cadence as fast crawl or analytics alerts.